-
Matlab - Adaptive Filter
MATLAB Simulation
A series of 3 MATLAB simulations are carried out to demonstrate the action of the adaptive filter.
Time Domain Analysis of NLMS filter
The group measured the effect of using a NLMS filter to do ANC on a random noise waveform, with varying values of step size. The results are shown below at the error microphone: 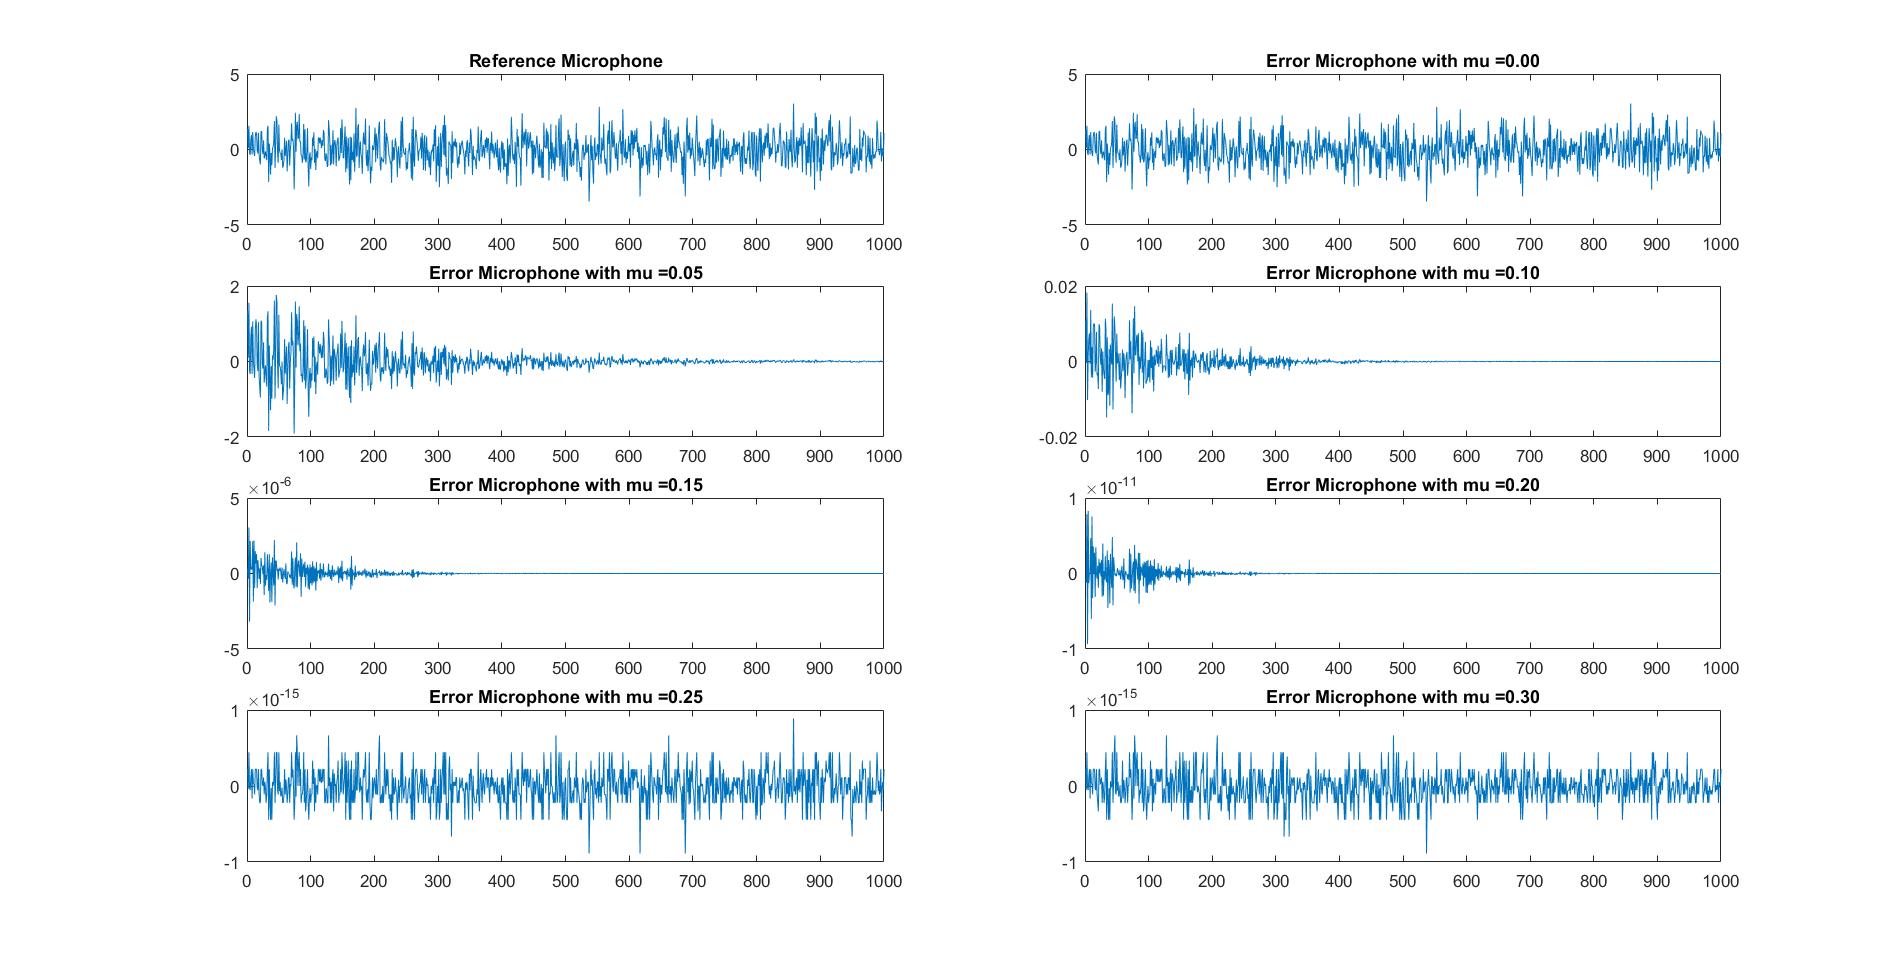
What is observed is that adaptation to zero happens quicker with increasing values of mu, until a step size of 0.25 is reached, where the system becomes unstable and noise is no longer cancelled. This demonstrates what was elaborated on in a previous section.
Signal to Noise Ratio(SNR)
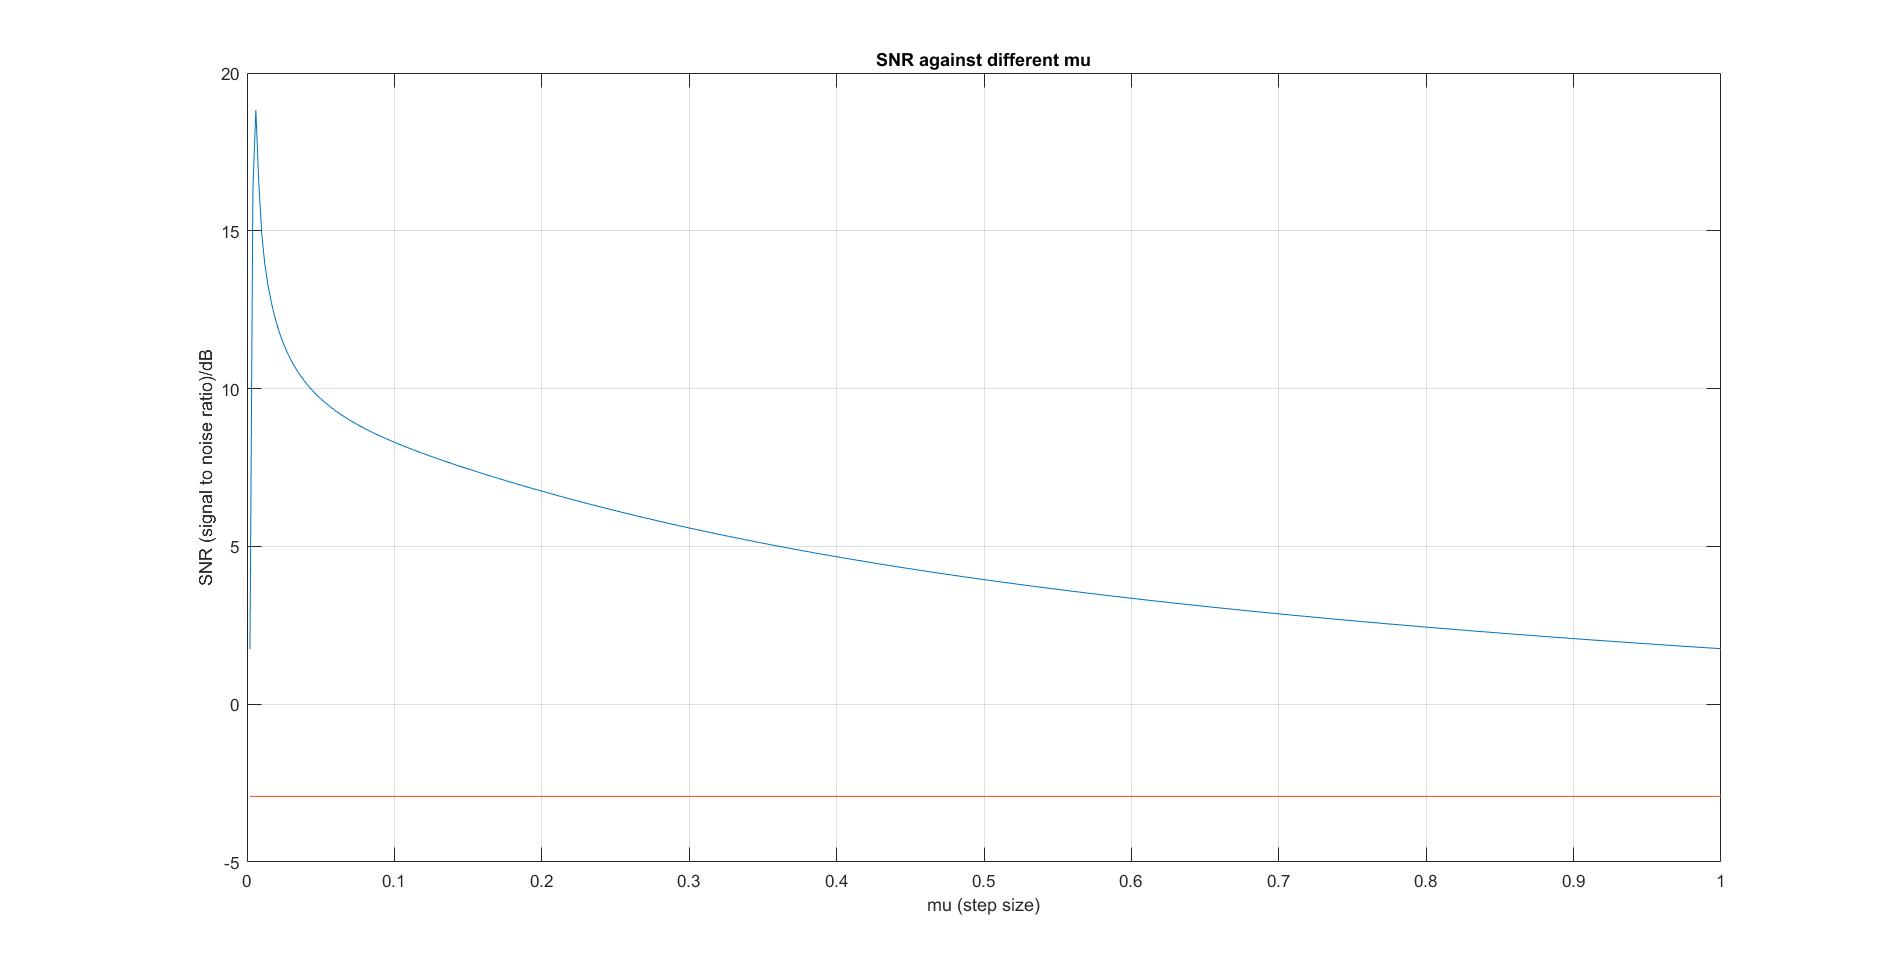
Analysis of NLMS filter This example takes a sine wave of frequency 100 Hz and peak to peak amplitude 2 as a signal, and is corrupted by some random noise. This noisy wave is then passed through an NLMS filter to get rid of the random noise. SNR variation with respect to mu was then measured, at the error microphone. The results are shown below:
The red line represents the SNR of the original noisy signal, while the blue line represents the filtered signal. SNR shoots up very rapidly, followed by a decrease with decreasing rate in SNR as mu approaches infinity and SNR approaches 0.
Filtered-X LMS
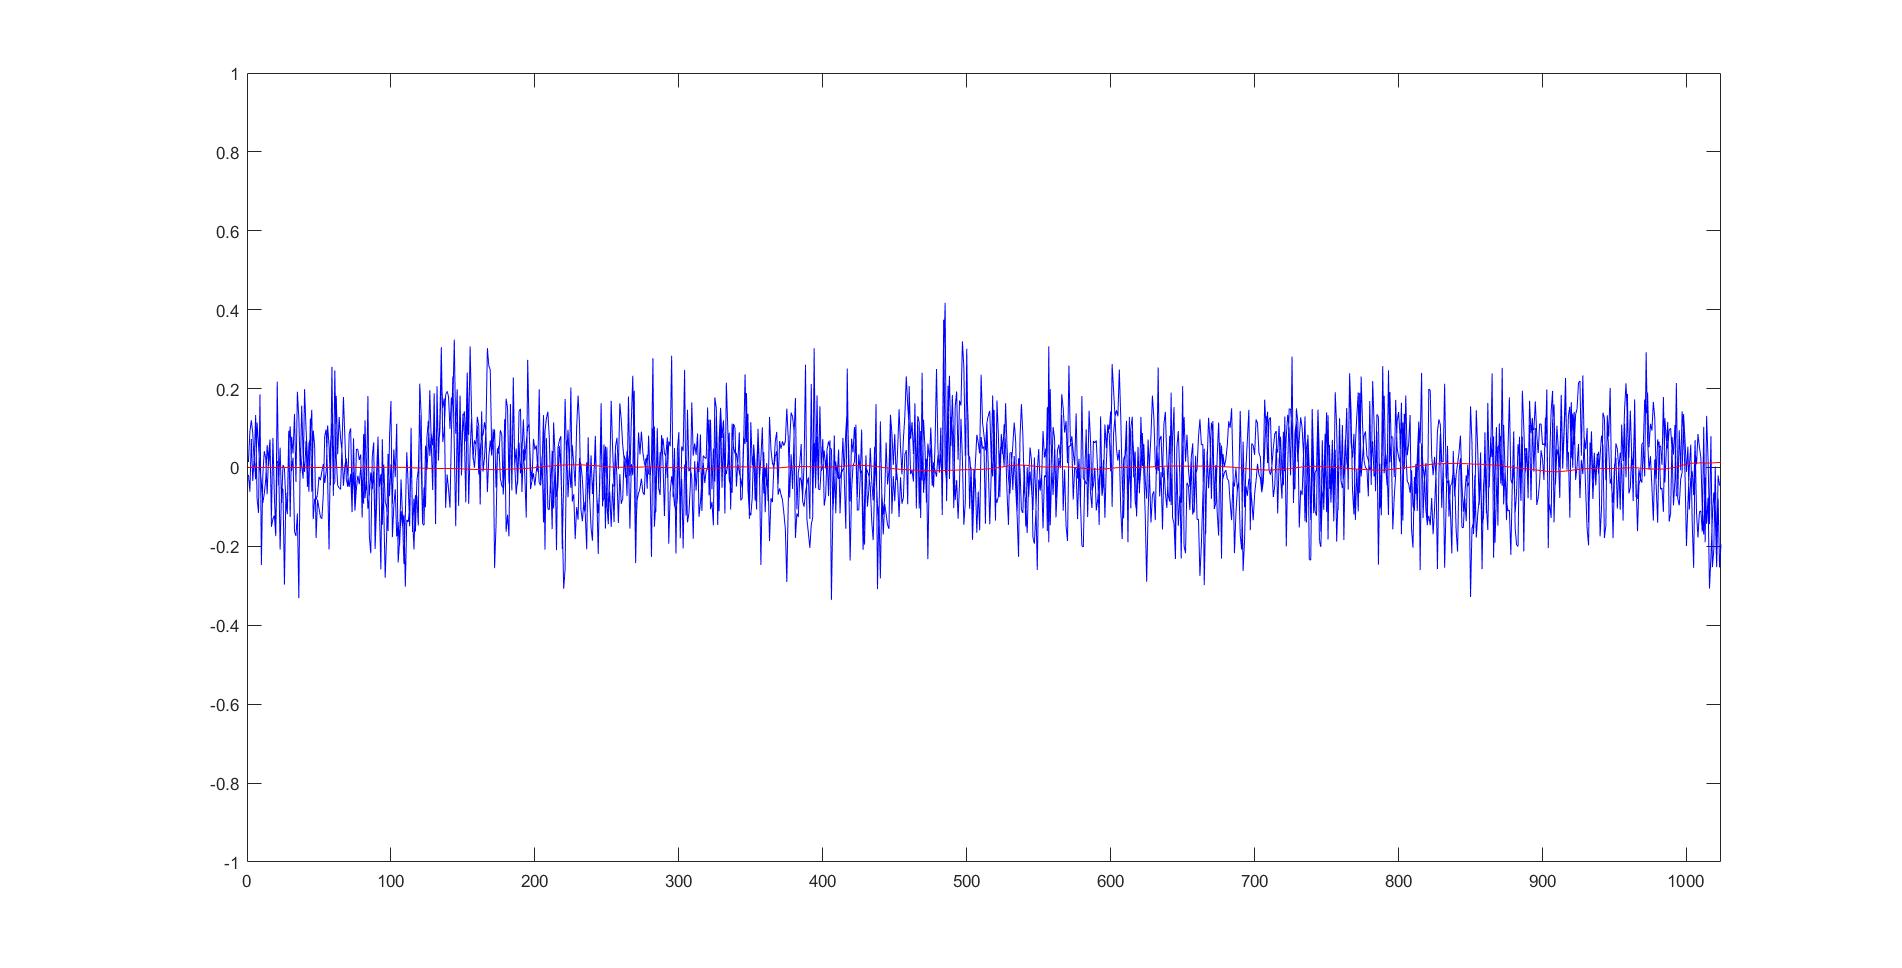
This example simulates the effect of Filtered-X LMS on the noise waveforms measured in the computer lab. A step size of 0.008 is used, and a FIR filter is used to simulate the secondary path. An amplitude time graph of the action of the filter is shown below:
The blue waveform represents the noisy signal, while the red waveform represents the filtered waveform measured at the error microphone. As can be observed, there is a very notable attenuation in noise. This demonstrates how the Filtered-X LMS filter will be used in controlling noise - the waveform represents what the listener hears and shows that the filter can theoretically be very effective in noise cancellation.
Below is a link to our GitHub page where you can download our MATLAB files
Download!