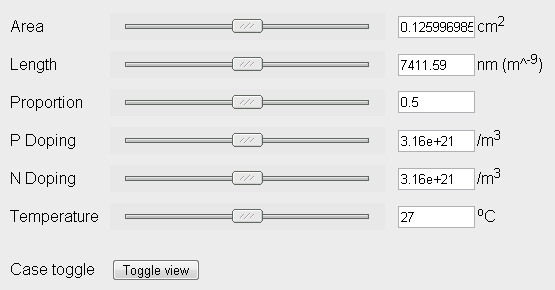
Figure 1: Default Positions
In this part of the report we will evaluate the internal configuration of EEVIL, including the user interface, simulation and graphing properties and even security.
The general layout is simplistic and uncluttered, which removes the potential hassle of navigation for the user. For example, explicit instructions are available on the page to toggle the display, which hides or unravels all the sections simultaneously and there is also the option to hide/unhide individual sections. Intuitive buttons and controls complement the instructions throughout.
However, user experience might be marred by slow interface response, and so usage might not be as sleek as desired. For example, the sliding down of the various sections upon toggling makes the system appear slower.
Various sections of the program were analysed and are as follows:
There is a table with different variable parameters that can be changed by sliders (Figure 1).
The various parameters have these respective limitations:
The use of sliders makes adjustment of parameters intuitive and effortless. However, the user might need to input specific values for diode parameters and this is where the system falls short. The parameter values in the text box can be visibly changed but they do not trigger a change in the diode model, graphs or sliders. Also, there is also no explanation of what the parameters truly represent, which could be confusing to a beginner to the subject.
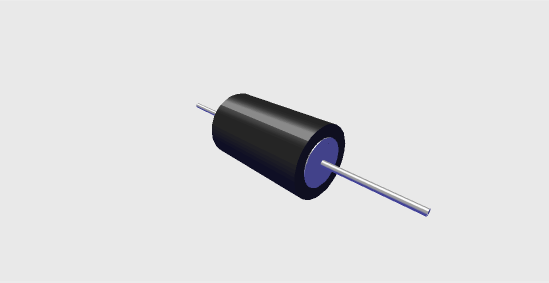
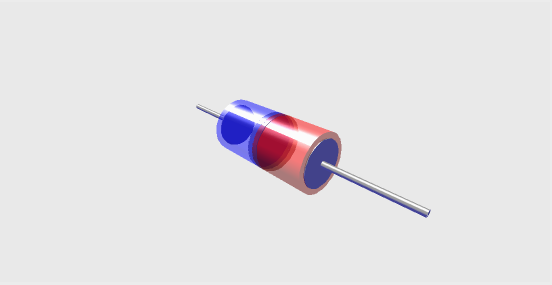
EEVIL displays a diode model showing its shape and size when any change is made in the different external parameters. This model is a cylindrical diode with a black outline and a blue core (Figure 2). In this default state the diode is shown simply as a resistor-like object so it is not immediately obvious what is being represented. However clicking on the "toggle view" button, it changes to the picture below with clearly shown respective scaled areas of N-doping and P-doping in the diode (Figure 3). However, this cross-sectional view only works with Internet Explorer.
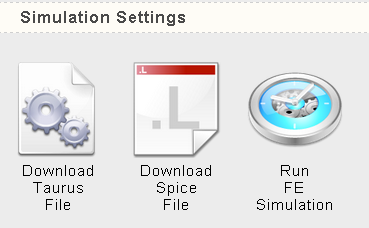
EEVIL provides the user with three simulation options (Figure 4). By default, the simulation settings are hidden from view. The three options available include downloading a Taurus or Spice file and running an FE simulation. These settings are currently not completely functional as some links are not working.
Graphs are generated based on the following equations as introduced in the first year curricula:
With these equations, six graphs can be displayed by the program (Figure 5). They are:

The graphs' do not have variable axis values, and as such the graphs are inconclusive at extremes since they cannot be zoomed into.
When a graph is clicked on, a larger view of it appears which can be saved as a JPEG (Figure 6). However, there is no provided link to save this image and the corresponding parameters of the diode are not included in the page.
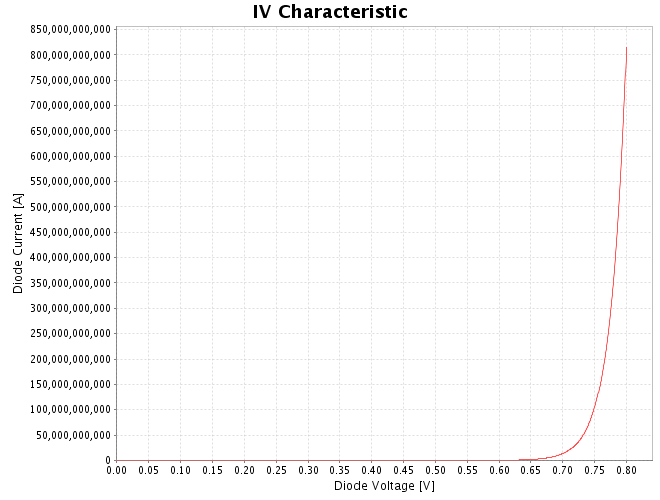
There is also some confusion caused by the lack of uniformity in the axis labelling of diode current. As shown in figure 5, diode current is labelled as "I [Amps]" in the small-signal resistance graph, but as "Diode Current [A]" in the power dissipation graph.
At upper and lower limits of parameter values, the small-signal resistance, IV characteristic and power dissipation graphs give no results. Also, unrealistic results could be obtained from certain configurations of parameters due to non-existent points of breakdown. (Figure 6)
The system is set up so that everything except the diode image is Server side. This means that when the user changes one of the parameters using a slider, the new parameters are sent to the server. The server then generates the diode behaviour from these parameters, plots the graphs, then sends the graphs as images through to the client. To speed up this process the server has a cache of up to 10,000 images, so when a new graph is generated the image is saved to the cache so that when someone else sends a request with the same parameters the server can just send the image instead of regenerating the graphs each time.
This approach was taken due to an initial fear about how widespread browser Java-virtual-machine (JVM) support was, coupled with the questions about personal computer processing power, especially on Netbooks which have a reasonably wide use in the department. However, this should no longer be a problem, as JVMs are present in all major browsers, and even Netbooks are likely to have enough processing power to manage EEVIL's functionality.
The lack of graph manipulation is inherent in the current implementation of the software, because each time user changes the settings a new image needs to be sent, leading to a high data transmission requirement. This means that for every potential manipulation – zooming, panning, selecting comparisons, etc. – a new image will have to be sent from the server. Consequently, implementing graphical manipulation with the software as it is would place too great a load on both server and connection. Furthermore, if the user wanted to export the graphs or data, this would again be a separate request, with further bandwidth requirements.
This high data transmission requirement leads to another problem: bandwidth. Although the Giga-bit (Gb) Ethernet connection to the computing labs can easily manage all the image transmission, the 54Mb/s wireless connection in our lecture theatre (EEE; Room 408) became saturated when tested with approximately forty laptops using EEVIL. This means that although a lab session using EEVIL would be possible, a lecture, with students using the system on laptops, would not. Furthermore, if outside of college on a slow broadband, 3G, or dial-up connection it is possible that EEVIL will lag enough to become problematic, if not unusable.

The keys on the top right hand of the webpage are meant as a 'log off' link (Figure 7). They do redirect back to the login page (eevil.ee.ic.av.uk/login), but do not end the current user session. This means that another user could click on a device link and be redirected without logging in first. This is not an immediate problem since no content is yet user specific, if functions such as saved settings were implemented, a new user could change or remove them.