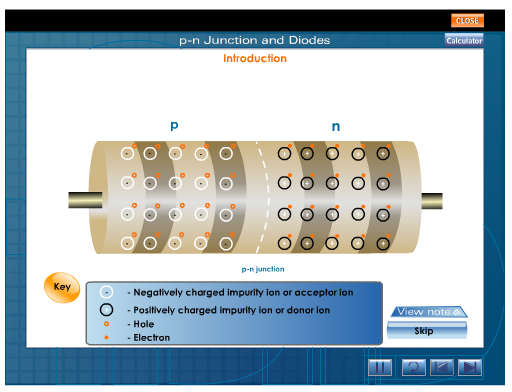
Figure 8: Tutorial with Electron and Hole Movements
The ability to choose between different simulations and complexities could be introduced, possibly with checkboxes or drop-down boxes. This would enable the user to select between different modes of simulation, for example adding in biasing voltages and/or currents, testing in fields of different intensities (electric, magnetic, light if P-V cells introduced, etc.). It could also make it possible to introduce further complexity beyond the 'short' diode approximations (as utilised in the EE1 Devices course) currently implemented: these include taking into account factors such as recombination, depletion width, carrier injection, drift currents; etc. This will broaden the scope of the software, making it useful to the Second Year Devices course and beyond. EEVIL also has the potential to simulate a 'real' diode suitable for research purposes.
The cross-sectional view of the diode could be developed further by showing the movement of holes and electrons together with the relevant depletion regions and the boundary between. This will help the user to better understand electron-hole behaviour.
The above tutorial takes the form of a slide-show (with voice-over) of the workings of a diode (PN Junction). It includes information on P- and N-type semiconductors as well as exact hole and election movement when they are put in contact.
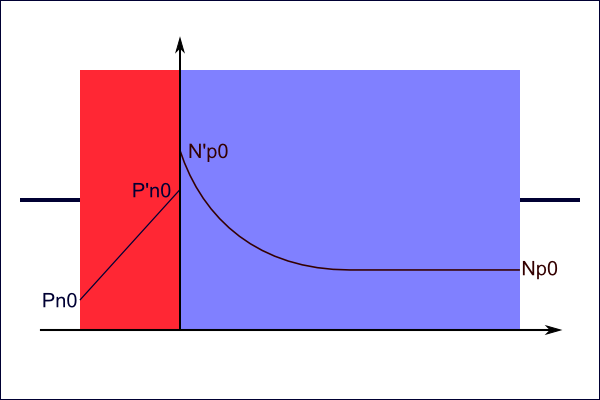
Graphs of minority carrier concentration and energy level diagrams could be included to illustrate different properties, such as effects of doping and recombination. For example, figure 8 below shows the graph of minority carrier concentration, and figure 9 illustrates the energy level diagram.
The user should have access to a selection of preset settings available for each device, showing key operating points, doping differences, useful comparisons, and etc. so as to enable quick understanding and/or revision of particular devices; this would be particularly useful in conjunction with biasing conditions for example. If an accurate enough simulation is available it could also have some diodes used in the EE Lab set as presets, enabling user to compare their own diodes with commercially available ones.
Students should be allowed to save and print relevant settings, as they could easily be stored to the server under the users login, or if short on space, as cookies in the browser. This will help them to reference specific settings for various purposes, and then return to continue work from before.
If more than one type of diode or transistor is operational, students should be able to compare between them. Tabled representations would be particularly helpful, to show the effects of changing certain parameters on the respective devices.
As the diode model is changed we should also be able to see a change in its dimensions with numerical labelling; for instance how the radius or length is changing. A pop up key is also a good idea.
The option of zooming into/out of the graphs should be allowed for better analysis. Also, in case the graph goes out of scale there should be an option to auto-scale the graph to a suitable scope.
If everything were to be moved Client-side instead of having it server-side, many problems would be solved and the scope of the project would be increased. This is because if calculations and rendering were all done client-side, the client would not have to send a request to the server for the new graph-images as they would then be generated on their computers. This reduces the continuous traffic on the network, although it could potentially lead to a greater initial load time. Furthermore it would mean the graphs would be more easily manipulated and can be zoomed into, leading to an improved user experience. Also, including the option to export the graphs in a chosen format, or the raw data as needed (for Excel or MatLab for example) would be easily implemented. This move to Client-side would be possible as JVMs are now available for all modern browsers, and even Netbooks have reasonable processing power so it should hopefully not be too strenuous for the user’s computer.
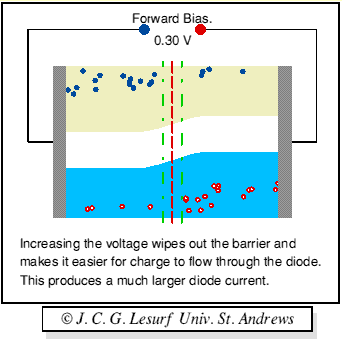
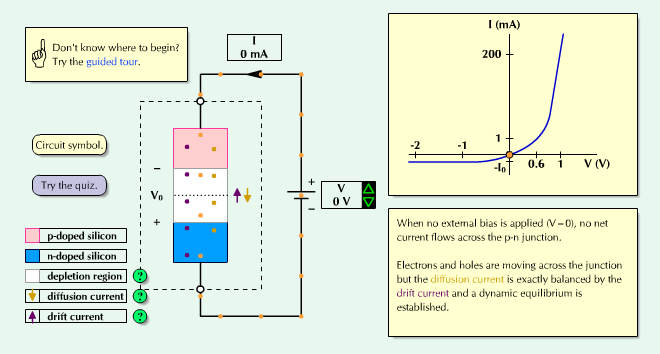
Even including the ability to connect the generated components up to a simple voltage/current source would help teach a lot about the component’s response. This could then be extended to include basic passive components, so the user could view the responses of the device connected into certain simple circuits, avoiding having to export a Spice/Taurus file and simulate for minor changes.
The figure above shows the use of an external voltage source involved in illustrating the diode’s large signal IV response, and simplistic movements of charge carriers. Note the clear labelling and boxes for explanations. There is also a very useful guided tour of the program which walks the user through the different properties of the diode and even a quiz to test your knowledge.