Design And Operation
Requirements Of The ELC
The generators that exists in these villages are in fact permanent magnet synchronous machines which means that we can simply apply Faraday's law of electromagnetic induction to see the
relationship between generator speed and the frequency of the voltage in the village. According to this law the voltage that is induced is directly proportional to the frequency of rotation,
this means that we can measure the voltage output to see how fast the generator is spinning.
Therefore based on this information it is possible to divide the role of the ELC into 3 different sections which will work together to keep the frequency of the generator as close to the 60Hz point as possible.
These stages are:
- The Input Stage: Reading the frequency of the voltage
- The Processing stage: Carrying out calculations using the micro-controller
- Output Stage: Using this data to turn on a combination of heating elements
which will be used to bring down the generator speed.
Input Stage
Having seen that the speed of rotation of the generator is in fact equal to the frequency of the voltage, it is clear that we can get an accurate representation of both values by
just simply measuring the frequency of the generated voltage. Therefore in order to do this we used an Arduino micro-controller which had the ability to measure frequencies of AC waveforms, however it was
not possible to just directly connect this to the generator as the 220V from the generator would have easily fried the chip.
So our team devised an opto-isolator circuit which was used instead, this was able to handle the 220V AC at the input and in turn output a ~6V AC waveform of the same frequency which could easily be read
in by the Arduino micro-controller. It was then possible for the Arduino to measure this frequency, which then gave us the speed of rotation of the generator.
The overview for this part of the circuit is shown in Figure 3.
If you would like to view this mechanism in more detail then click below.
Find Out More
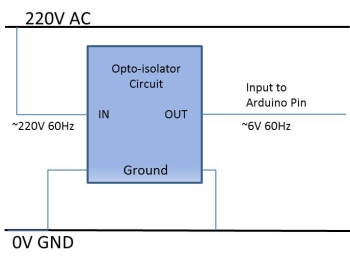
Figure 3: The basic overview of how to measure the frequency from a high voltage source
Processing Stage
The processing stage is implemented by the Arduino micro-controller which carries out a series of tasks after the input stage. Its main operation is to apply a control algorithm which will either increase or decrease the generator speed depending on the frequency that was read at the input stage of the circuit.
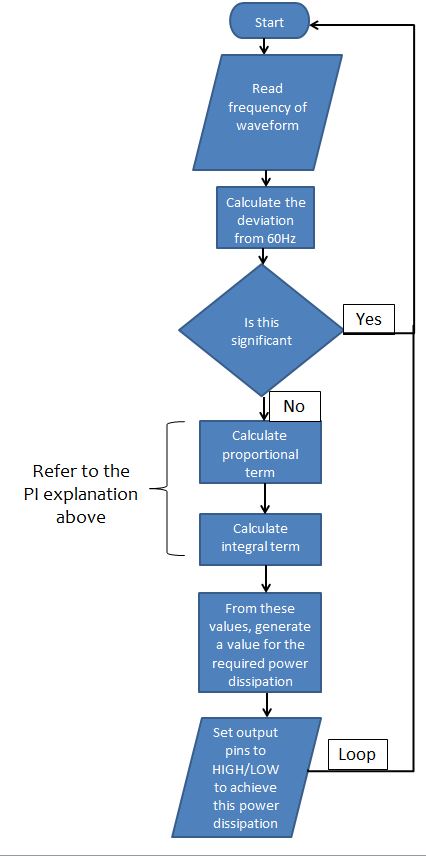
Figure 4: Basic Control Diagram
Figure 4: Basic Flow Chart of Micro-Controller Processes
Click below to see the main control loop and learn more about the PI control.
Find Out More
Figure 4 shows the basic block control diagram which governs how our overall system will operate and the main control algorithm for this block diagram is in fact implemented by our Arduino micro-controller. The method of control implemented by the micro-controller is PI (Proportional and Integral) control, this is a simple control loop feedback mechanism which is used to ensure that the frequency of the generator remains as close to the 60Hz point as possible.
- The frequency of the (lower magnitude) output waveform from the input stage is read in by the micro-controller. As seen above this does in fact have the same frequency as the generator voltage therefore this frequency value is identical to the speed of rotation of the generator.
- This frequency is then compared with the required 60Hz frequency in order to obtain the error value which tells us by how much the generator speed is incorrect. If the difference is hugely significant then the next stage is carried out, otherwise we can usually ignore it as a very small error will not be so crucial.
- The PI control carries out a series of calculations with this error, at the end of these processes it will have a value representing how much system should response to this error. The higher the number, the higher the speed of the generator is compared to 60Hz. Hence more drastic action will have to be taken in order to bring the generator speed back to 60Hz.
-
Then depending on this value, the program will then also turn on the correct combination of heating elements which are
connected to the output side and these will dissipate the excess power in the form of heat.
In the case that the generator is spinning too slow, it signifies that the load on the generator is too large. Therefore the program will turn off as many heating elements as possible to reduce the power dissipation as much as possible and bring the generator speed back up to 60Hz.
Otherwise if the generator is spinning too fast, it signifies that the load on the generator is too small. Therefore the program will turn on a suitable amount of heating elements in order to increase power consumption and bring the generator speed back down to 60Hz.
Output Stage
The output stage consists of switching and heating elements. Its main purpose is to dissipate the excess power that is not being used by village in the form of heat energy, thereby keeping the load on the generator steady and hence keeping its speed constant. There are in fact 5 heating elements within this particular design which all operate at 2kW, allowing us to dissipate 10kW in total if we need to. The tasks carried out by the output stage depend on the results of the calculations that took place within the micro-controller itself.
Figure 5 shows a basic diagram of the output side of the circuit and how it ties in with the micro-controller. Only a single switching mechanism and heating element are shown here.
The process is as follows:
- After the micro-controller has decided what the power dissipation should be, it will give 4 of the output pins on the Arduino a on/off value and PWM (Pulse Width Modulate). Since each heater can only dissipate 2kW it means that without some form of resolution we will not be able to dissipate power within the 2kW intervals. This is solve by using PWM on the last output pin which will vary the power dissipation of the last heater element between 0 and 2kW.
- When the output pin of the Arduino is given a HIGH it will activate the switching mechanism that is connected to that particular output as shown in Fig 5. Depending on the power dissipation required, a certain combination of switching mechanisms will be activated (with one switching element being operated by PWM).
- When a certain switching mechanism is set to active, it will cause a current to follow a path from the generator and through the heating element thereby turning this on and causing the required power dissipation.
To see a more detailed design of the load bank follow the link below.
Find Out More
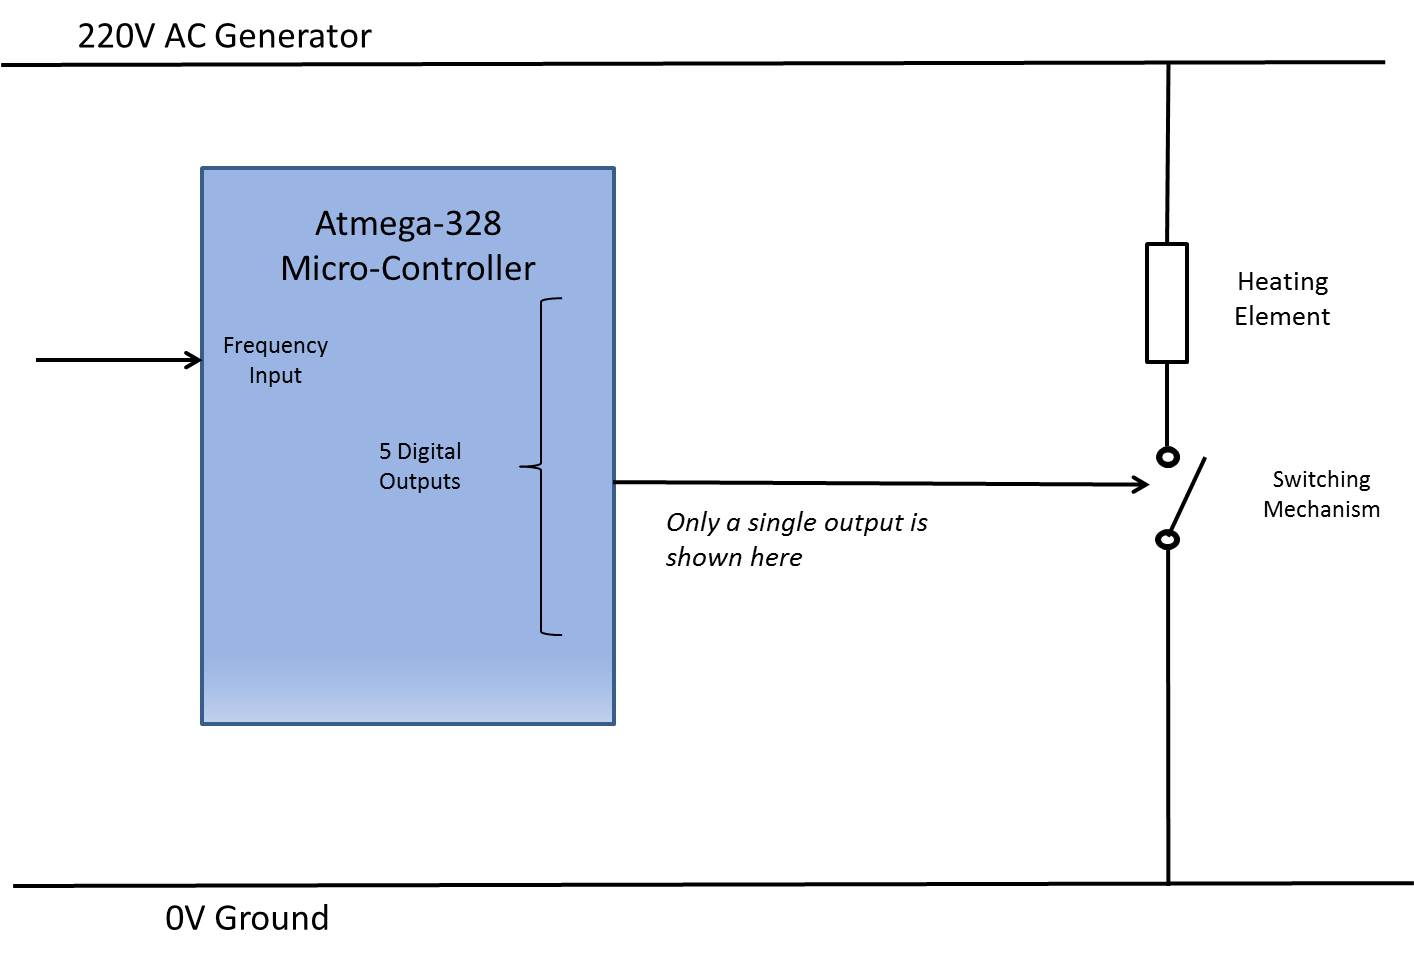
Figure 5: A diagram showing how the output stage is configured in relation to the micro-controller