Frequency Measurement Circuit
The following page shows the opto-isolator circuit that was used to measure the frequency of the generator voltage, and it also shows the testing procedure and results associated with it.
Circuit Diagram: Opto-Isolator
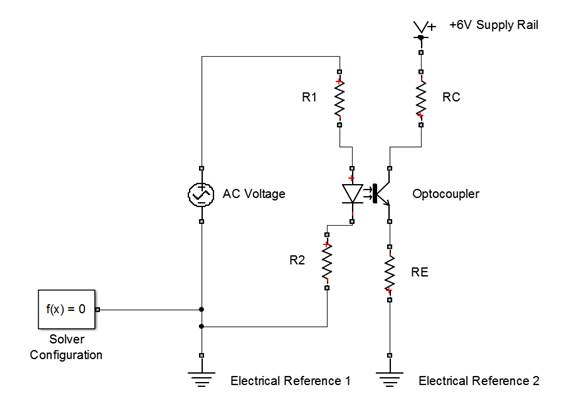
Figure 6: The Opto-Isolator Circuit Used To Read Frequency
How Does It Work?
-
The opto-isolator circuit (Fig 6) consists of 2 sections which are both electrically isolated from one another. The left hand side is solely made up of a LED (Light Emitting Diode) and a couple of resistors, whereas the right hand side consists of a BJT(Bi-Polar Junction Transistor) and some resistors.
-
On the left hand side we apply an AC voltage as the input which is usually of quite a large magnitude and resistors R1 and R2 are used to limit to current through the LED. This causes the LED's light intensity to alternate in a sinusoidal pattern whenever the voltage is positive, and the frequency of this light intensity oscillation is identical to that of the input voltage.
-
On the right hand side, the base of the BJT detects the varying light intensity that comes from the LED. This in turn causes the base current to alternate since this is sensitive to the light. Since collector and emitter currents are scaled versions of the base current, it follows that there is an alternating rectified current flowing through both RC and RE. Hence there is also an AC rectified voltage across RC and RE as well, both of which have the frequency of the original voltage source input, but just lower in amplitude.
Therefore in order to measure the frequency of the generator we can apply it's voltage across the input side of the opto-isolator circuit and add high power resistors to limit the current
through the diode. From this we can then take the voltage from the collector of the BJT and input it into the Arduino input, as it will be safe to do so now since the amplitude of the AC output
should only be around 3~5V maximum.
Testing Procedures And Results
In order to test out the functionality of this circuit we constructed the circuit itself and see the behaviour. Obviously we couldn't test it using an input of 220V AC so we and high power resistors just yet, therefore we scaled down the voltage and the resistor values in order to get an idea about the general behaviour of the circuit.
Test Circuit Conditions
- Voltage Input: 6V Peak-To-Peak at 60Hz
- Resistor R1: 1 kOhm
- Resistor R2: 1 kOhm
- Resistor RC: 1 kOhm
- Resistor RE: 200 Ohm
The specific opto-coupler component that was used in this circuit was in fact the FOD814, the datasheet for this device can be acquired from the Fairchild Semiconductor site here.
Collector Voltage Reading
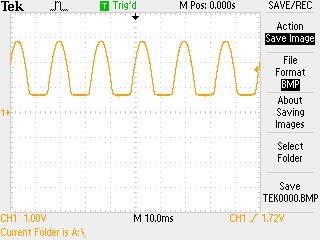
Figure 7: The voltage at the collector of the BJT
Conclusions
-
Figure 7 clearly shows us the voltage output at the collector of the BJT, and we can see that:
- The frequency of this signal is in fact 60Hz. This can be calculated by looking at horizontal time division on the oscilloscope and finding the time period for one wave.
- The peak-to-peak amplitude of the output wave is only 1.72V compared to the initial 6V.
Therefore we can in fact modify the circuit above to use higher value resistors with higher power ratings so that we can successfully read the frequency of the input when it is a 220V AC waveform and still obtain a smaller amplitude waveform at the output with the same frequency as the generator. It then follows that we can input this waveform into our Arduino pin safely without risk of damage.